top of page
Explore our latest projects!
From graphical abstracts and scientific figures to grant-winning infographics, each project was designed to make complex ideas clear and engaging. Whether it’s a striking graphical abstract, a figure that makes your data shine, or an infographic that helps win grants, our goal is simple: make your work stand out and get noticed.
 |  |  |
|---|---|---|
 |  |  |

From Data to Breakthroughs
Using powerful statistical tools like R, SigmaPlot, and Origin, we dig deep into your data while keeping every step transparent and easy to understand.
Whether it’s inferential, exploratory, or multivariate analysis, our reports are designed to make your results speak for themselves.
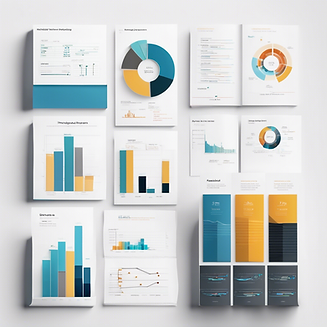
Download a sample of a complete data analysis report to see how your data can tell its best story.
bottom of page

